<img alt="" src="https://secure.page9awry.com/217738.png" style="display:none;">
User Analytics

PART 1: Identify and prioritise processes to digitalise for a quick RoI and maximum savings.

Don’t know where to start with Digital Transformation? Let Xenith identify your wasteful or inefficient processes and quantify how much time and money you can save with our User & Document Analytics.

Devices don’t print documents – users do. That’s why a user-centric view of document output is essential for a total picture of a document environment.

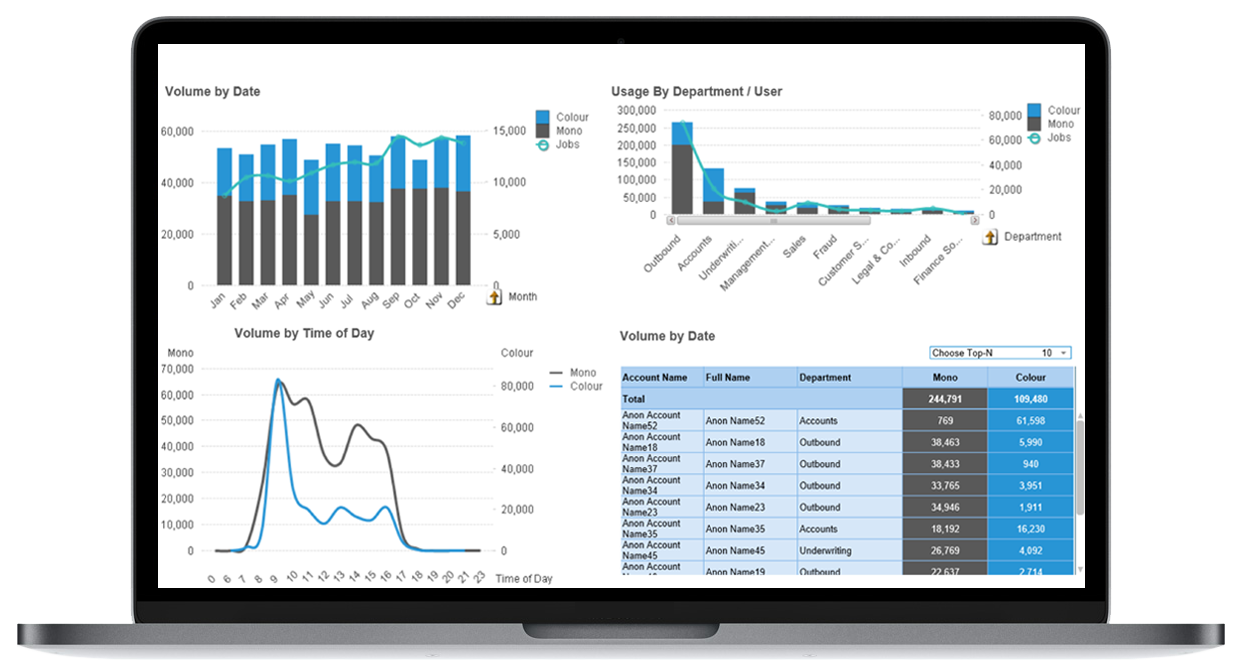
Xenith’s User Analytics is an intuitive dashboard offering overviews of your print environment, as well as the ability to drill down into the usage of individual departments, devices, and users.

Xenith’s analyst team assess and present the data to provide quick-win cost-saving recommendations as well as identify commonly used documents to further analyse with Document Analytics.

User Analytics - Available on any device

Benefits of User Analytics:

  • Quick-win cost saving recommendations
  • Ability to identify behavioural trends across your workforce
  • Benchmarking within your organisation
  • Identification of high-print users and departments
  • The possibility to identify commonly printed documents to be analysed further...
Click here to download the User and Document Analytics Brochure
Document Analytics

PART 2: Analyse and quantify paper-heavy processes

In this stage, we illustrate the role that printed documents and their associated processes play in your organisation.

A Xenith analyst will work collaboratively with you and your subject matter experts to explore your company’s most commonly used and most paper-heavy documents.

Ultimately this results in a table with an opportunity score to digitise for each process – this takes into account the average monthly print, number of touch points, number of employees involved and efficiency score.

Video: Identify & Eliminate Bad Paper Processes

Learn more about User and Document Analytics in our Brochure and Sample Report - Click here to download!
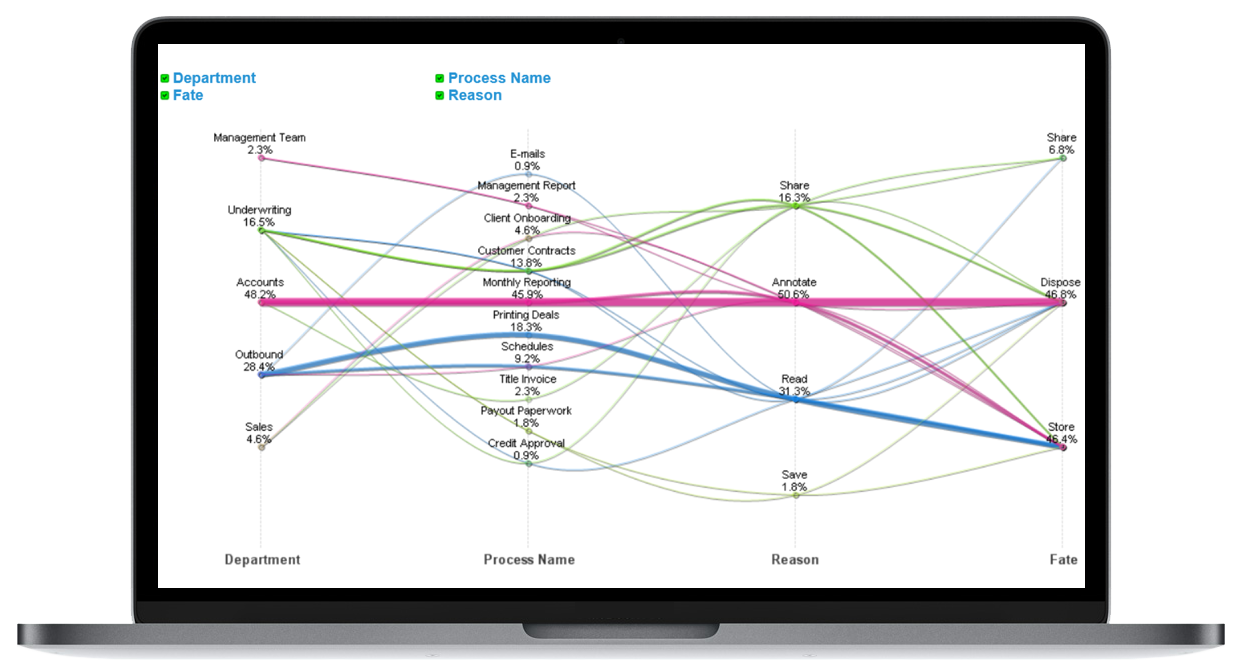
Document Analytics Graph

How it helps:

  • Explore the reasons why departments and individuals print the way they do
  • Uncover the fate of the documents you create
  • Identify an opportunity forecast of the most time consuming and paper-intensive processes
  • Evidence of how to automate your workflows

Get Started With A User & Document Analytics Assessment

Pricing

Get a 50% off the price of a User and Document Analytics Assessment using the code found in our Sustainability Guide or User and Document Analytics brochure. 

Fill in the form to get started!

Send us a message

speech-bubble-icon.png

Get in touch to let us know how we can help.
Call us on 020 7417 2000

Lots of third-party scripts in play, mobile scores simillar across pages which removes focus from codebase - Tidy up resource hints(https://www.debugbear.com/resource-hint-validator?url=https%3A%2F%2Fwww.xenith.co.uk%2F) - Consolidate third-party scripts to tag manager?